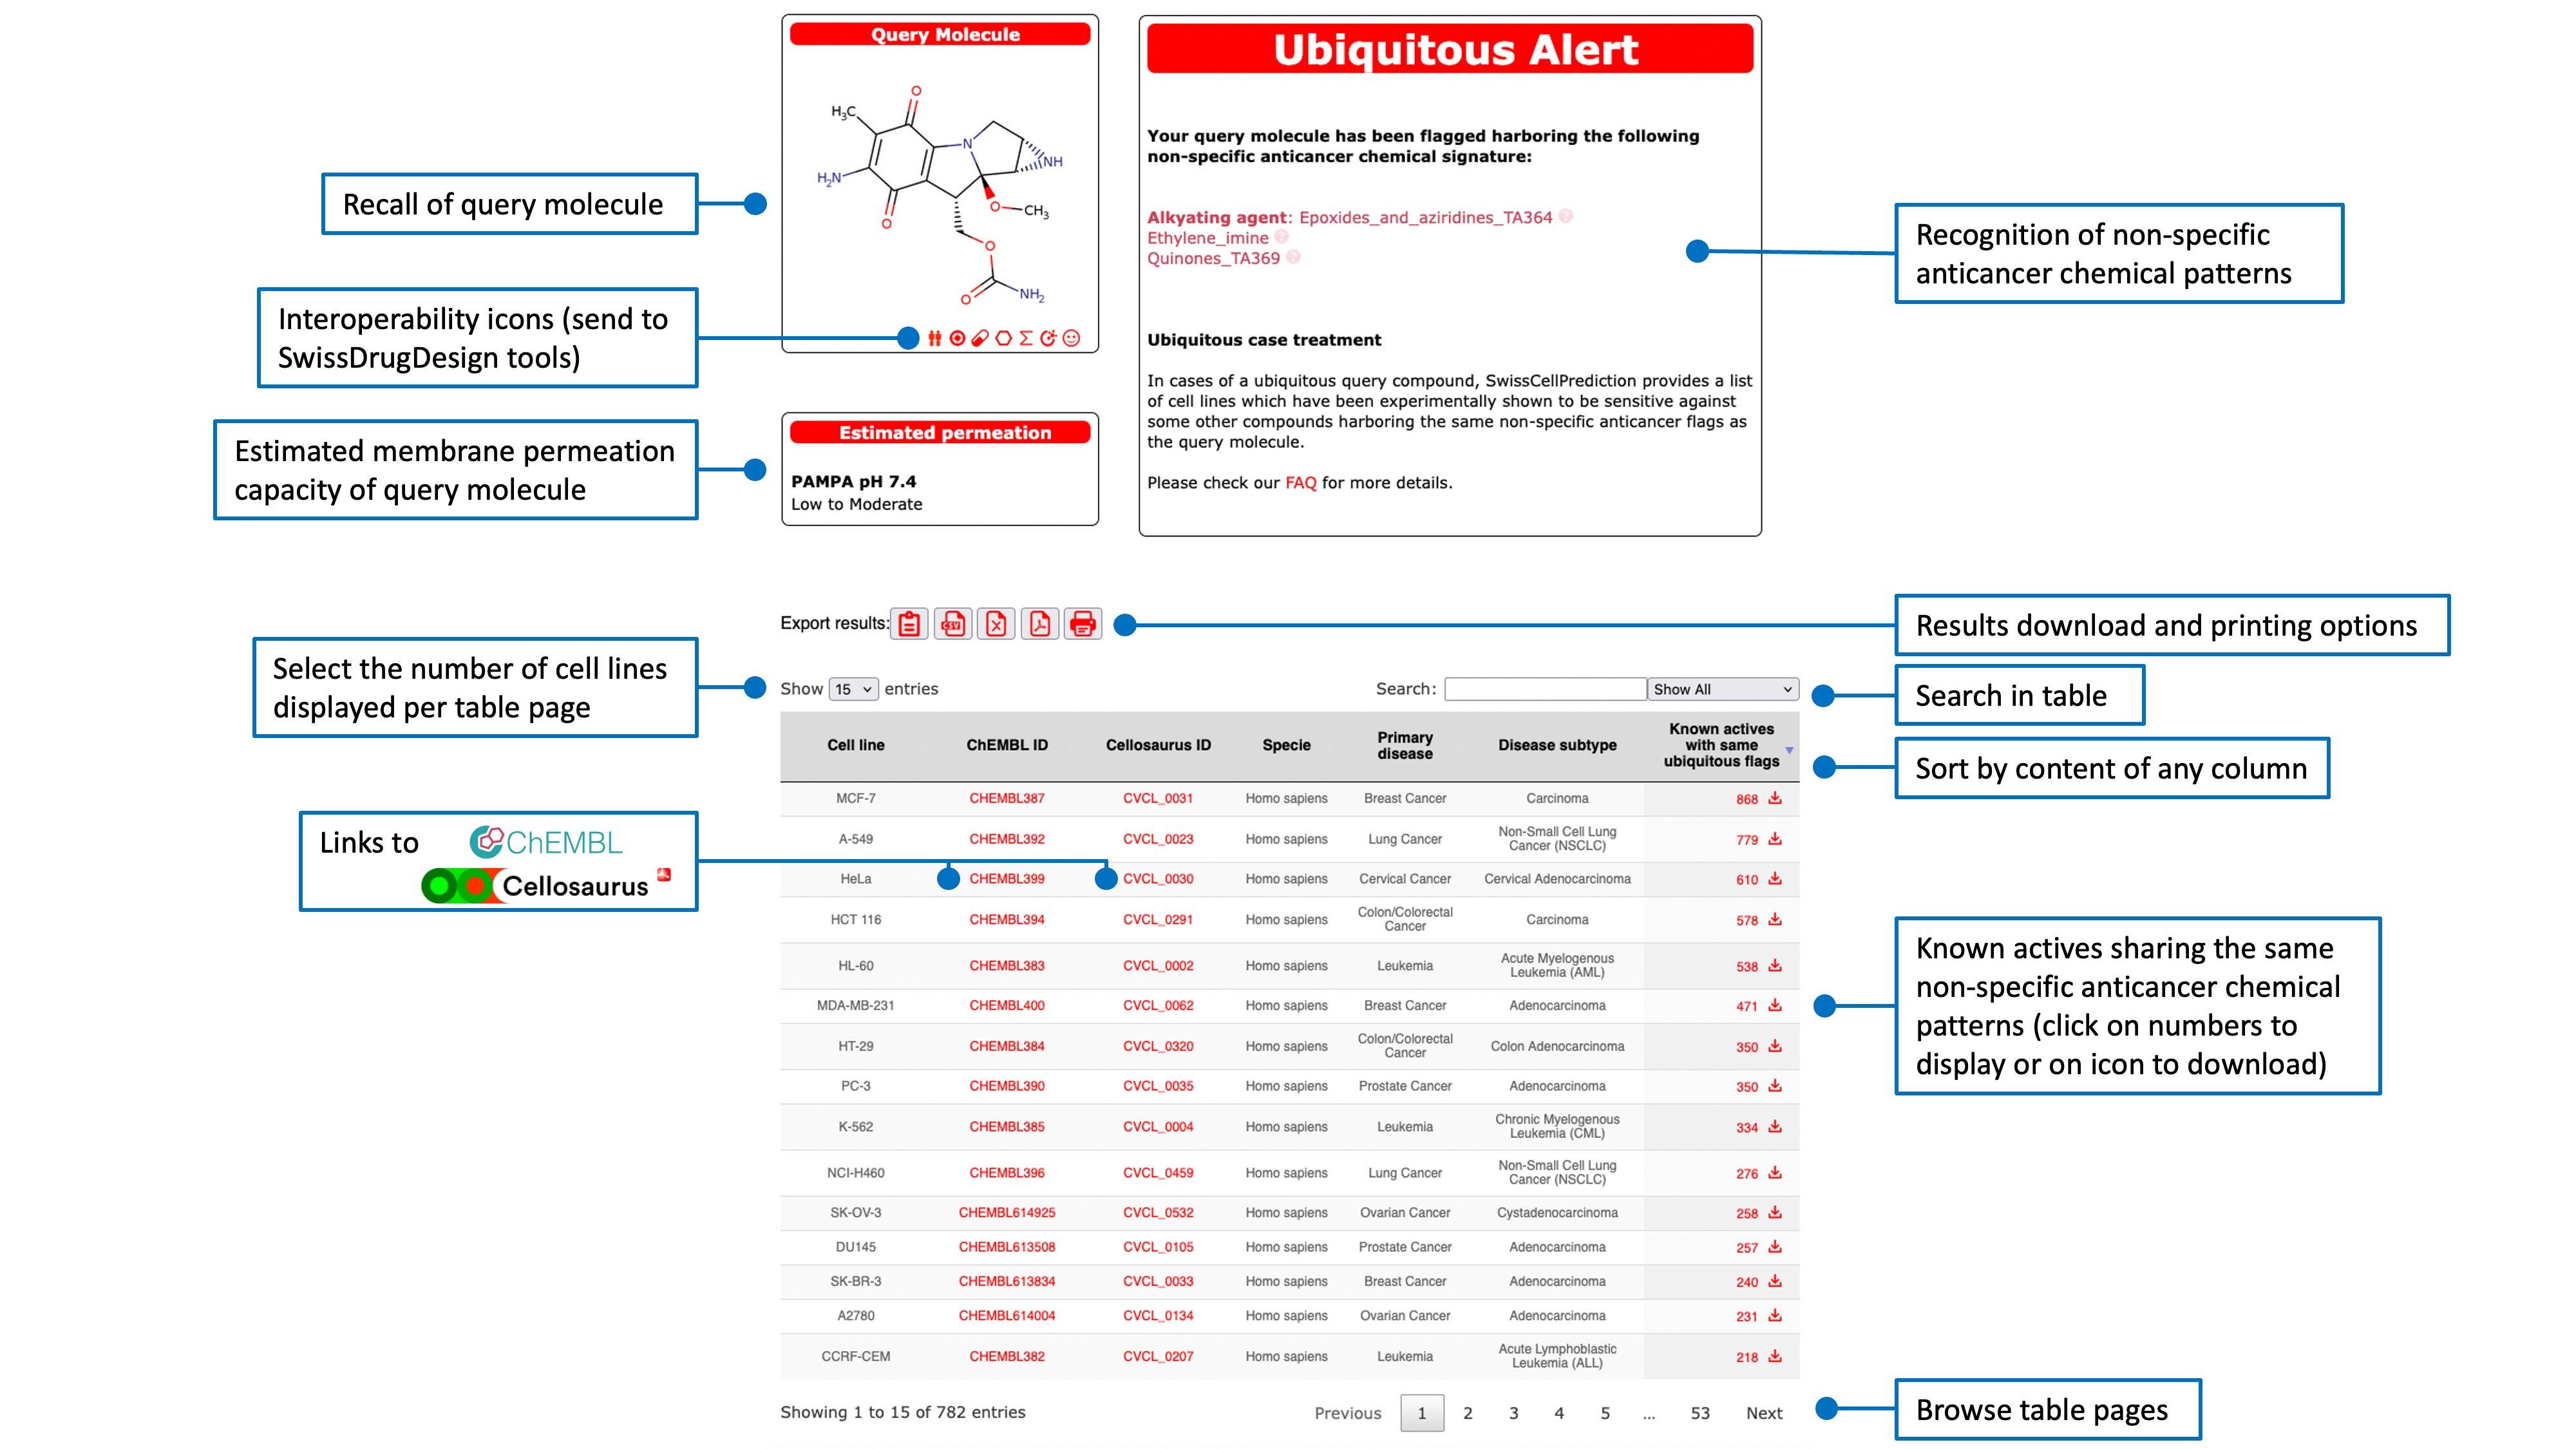


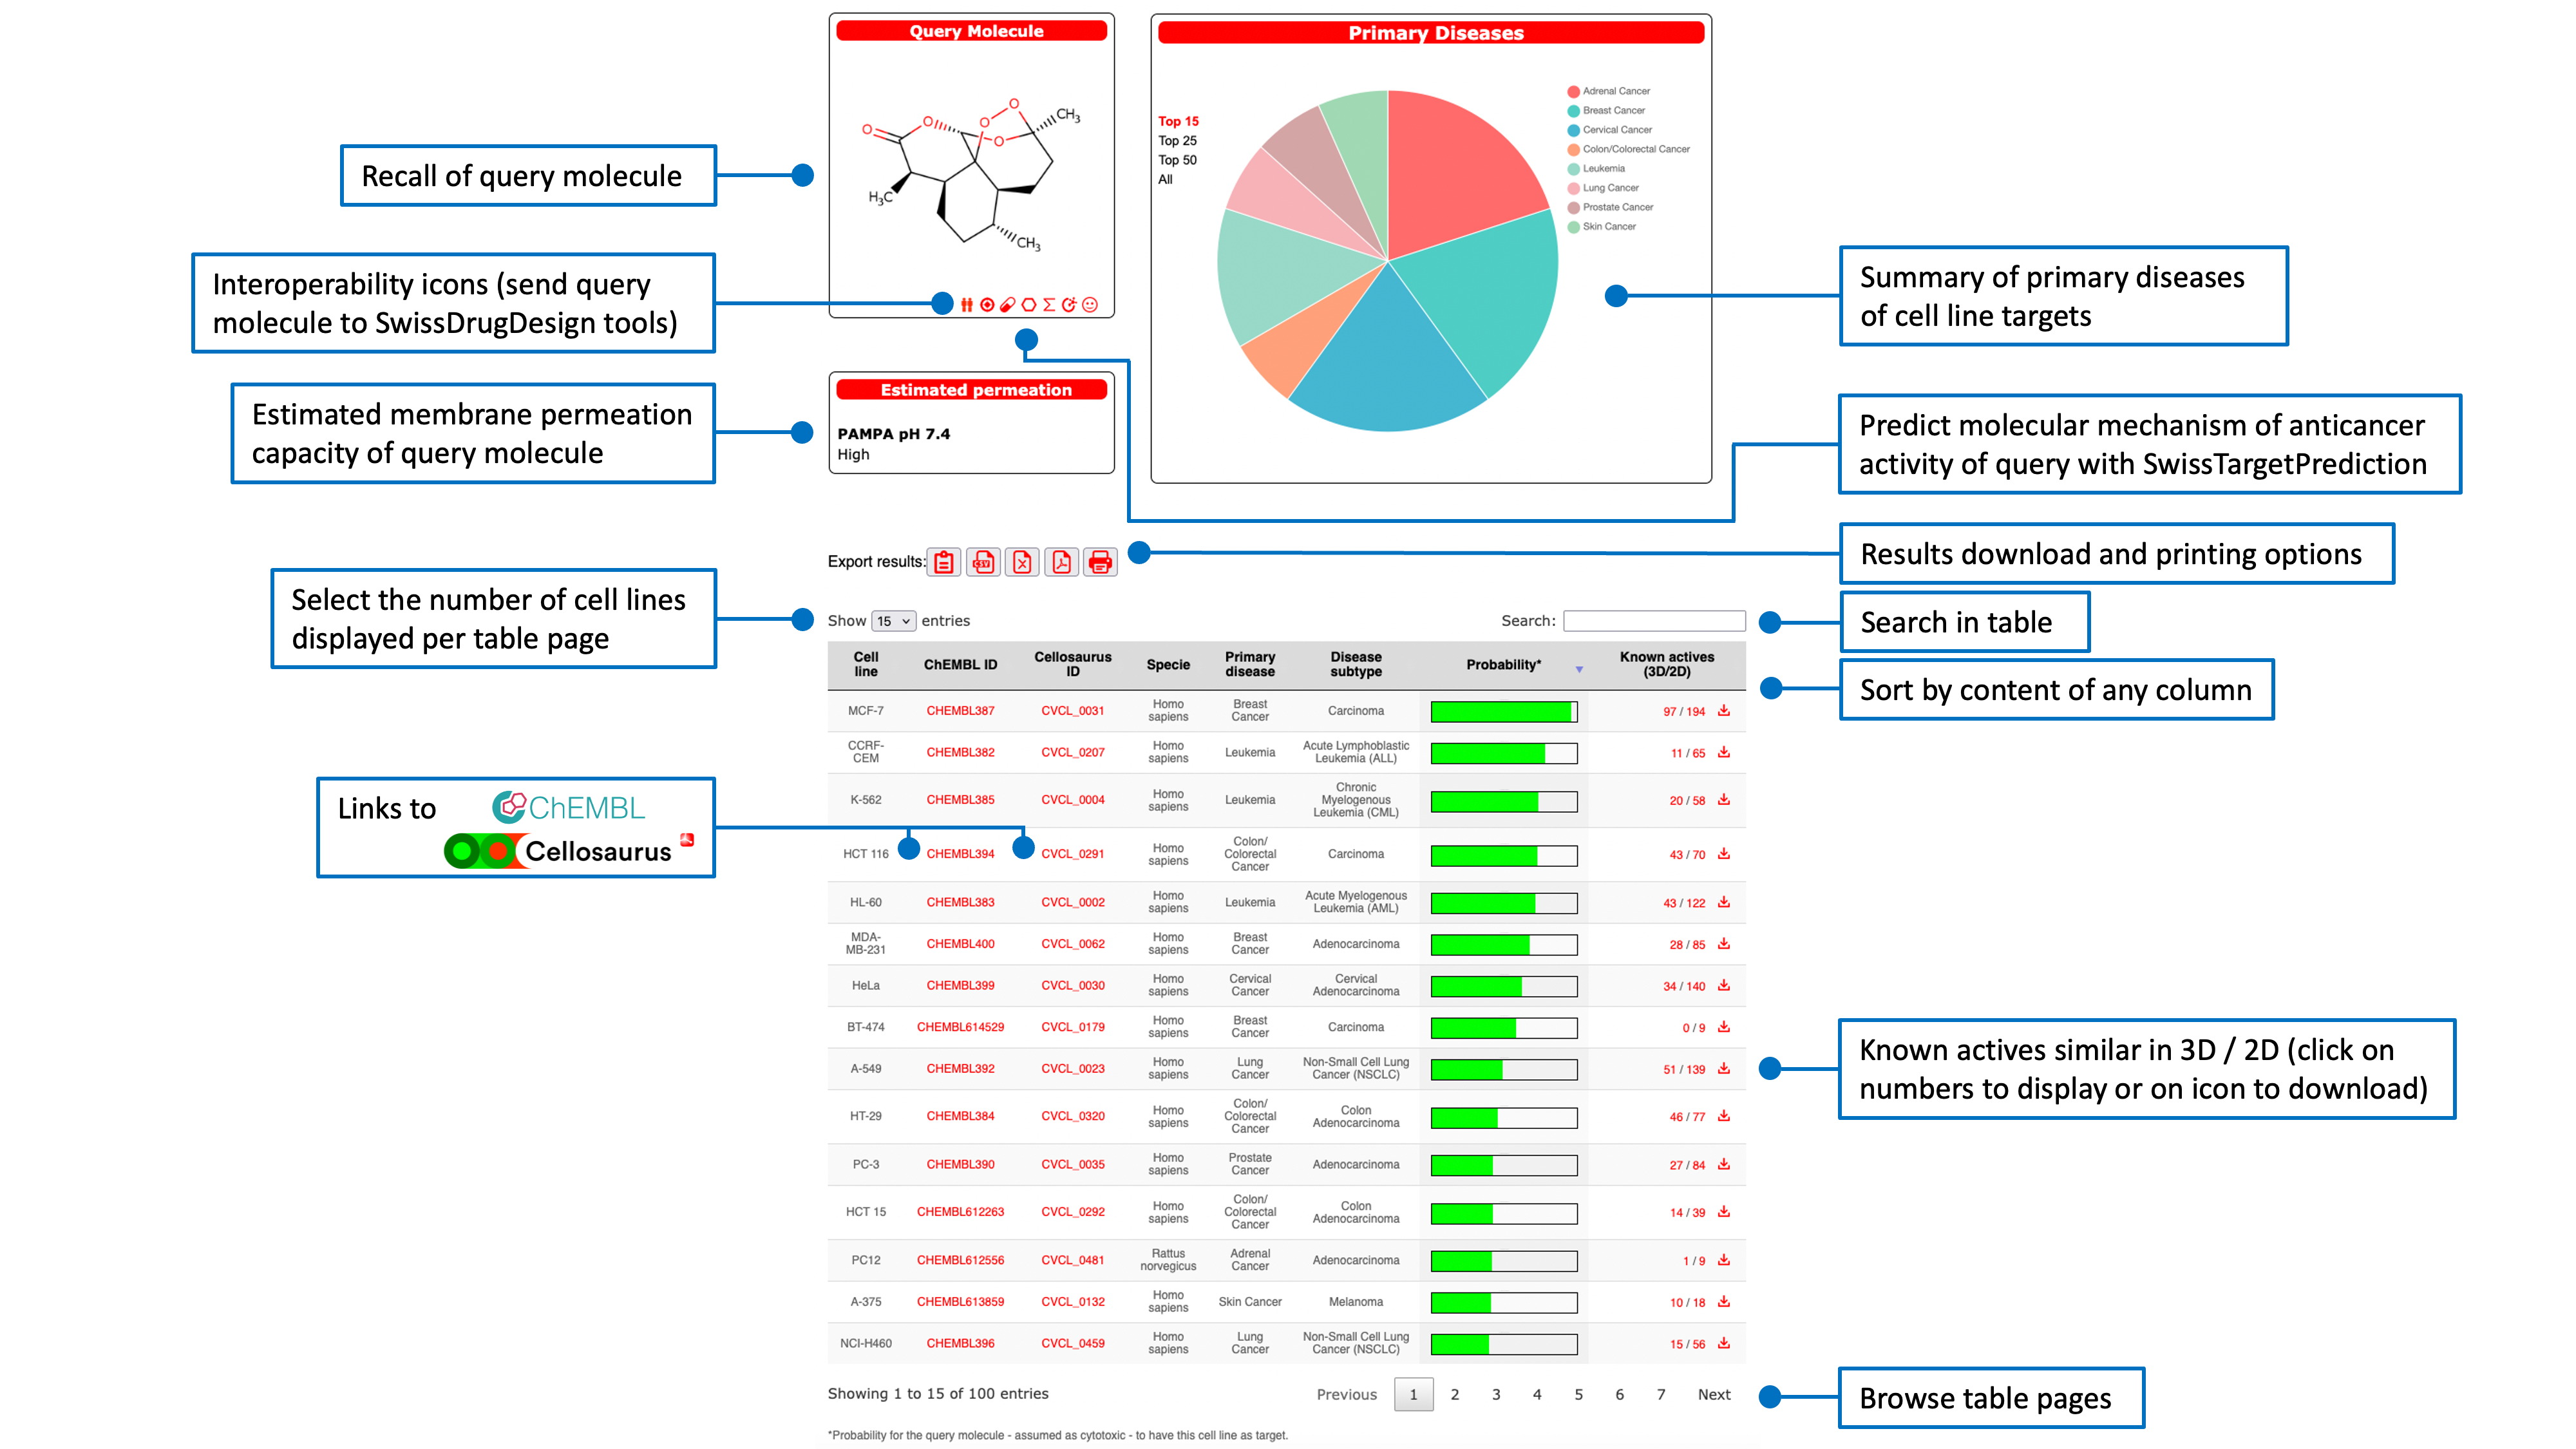
Result of ligand-based reverse screening
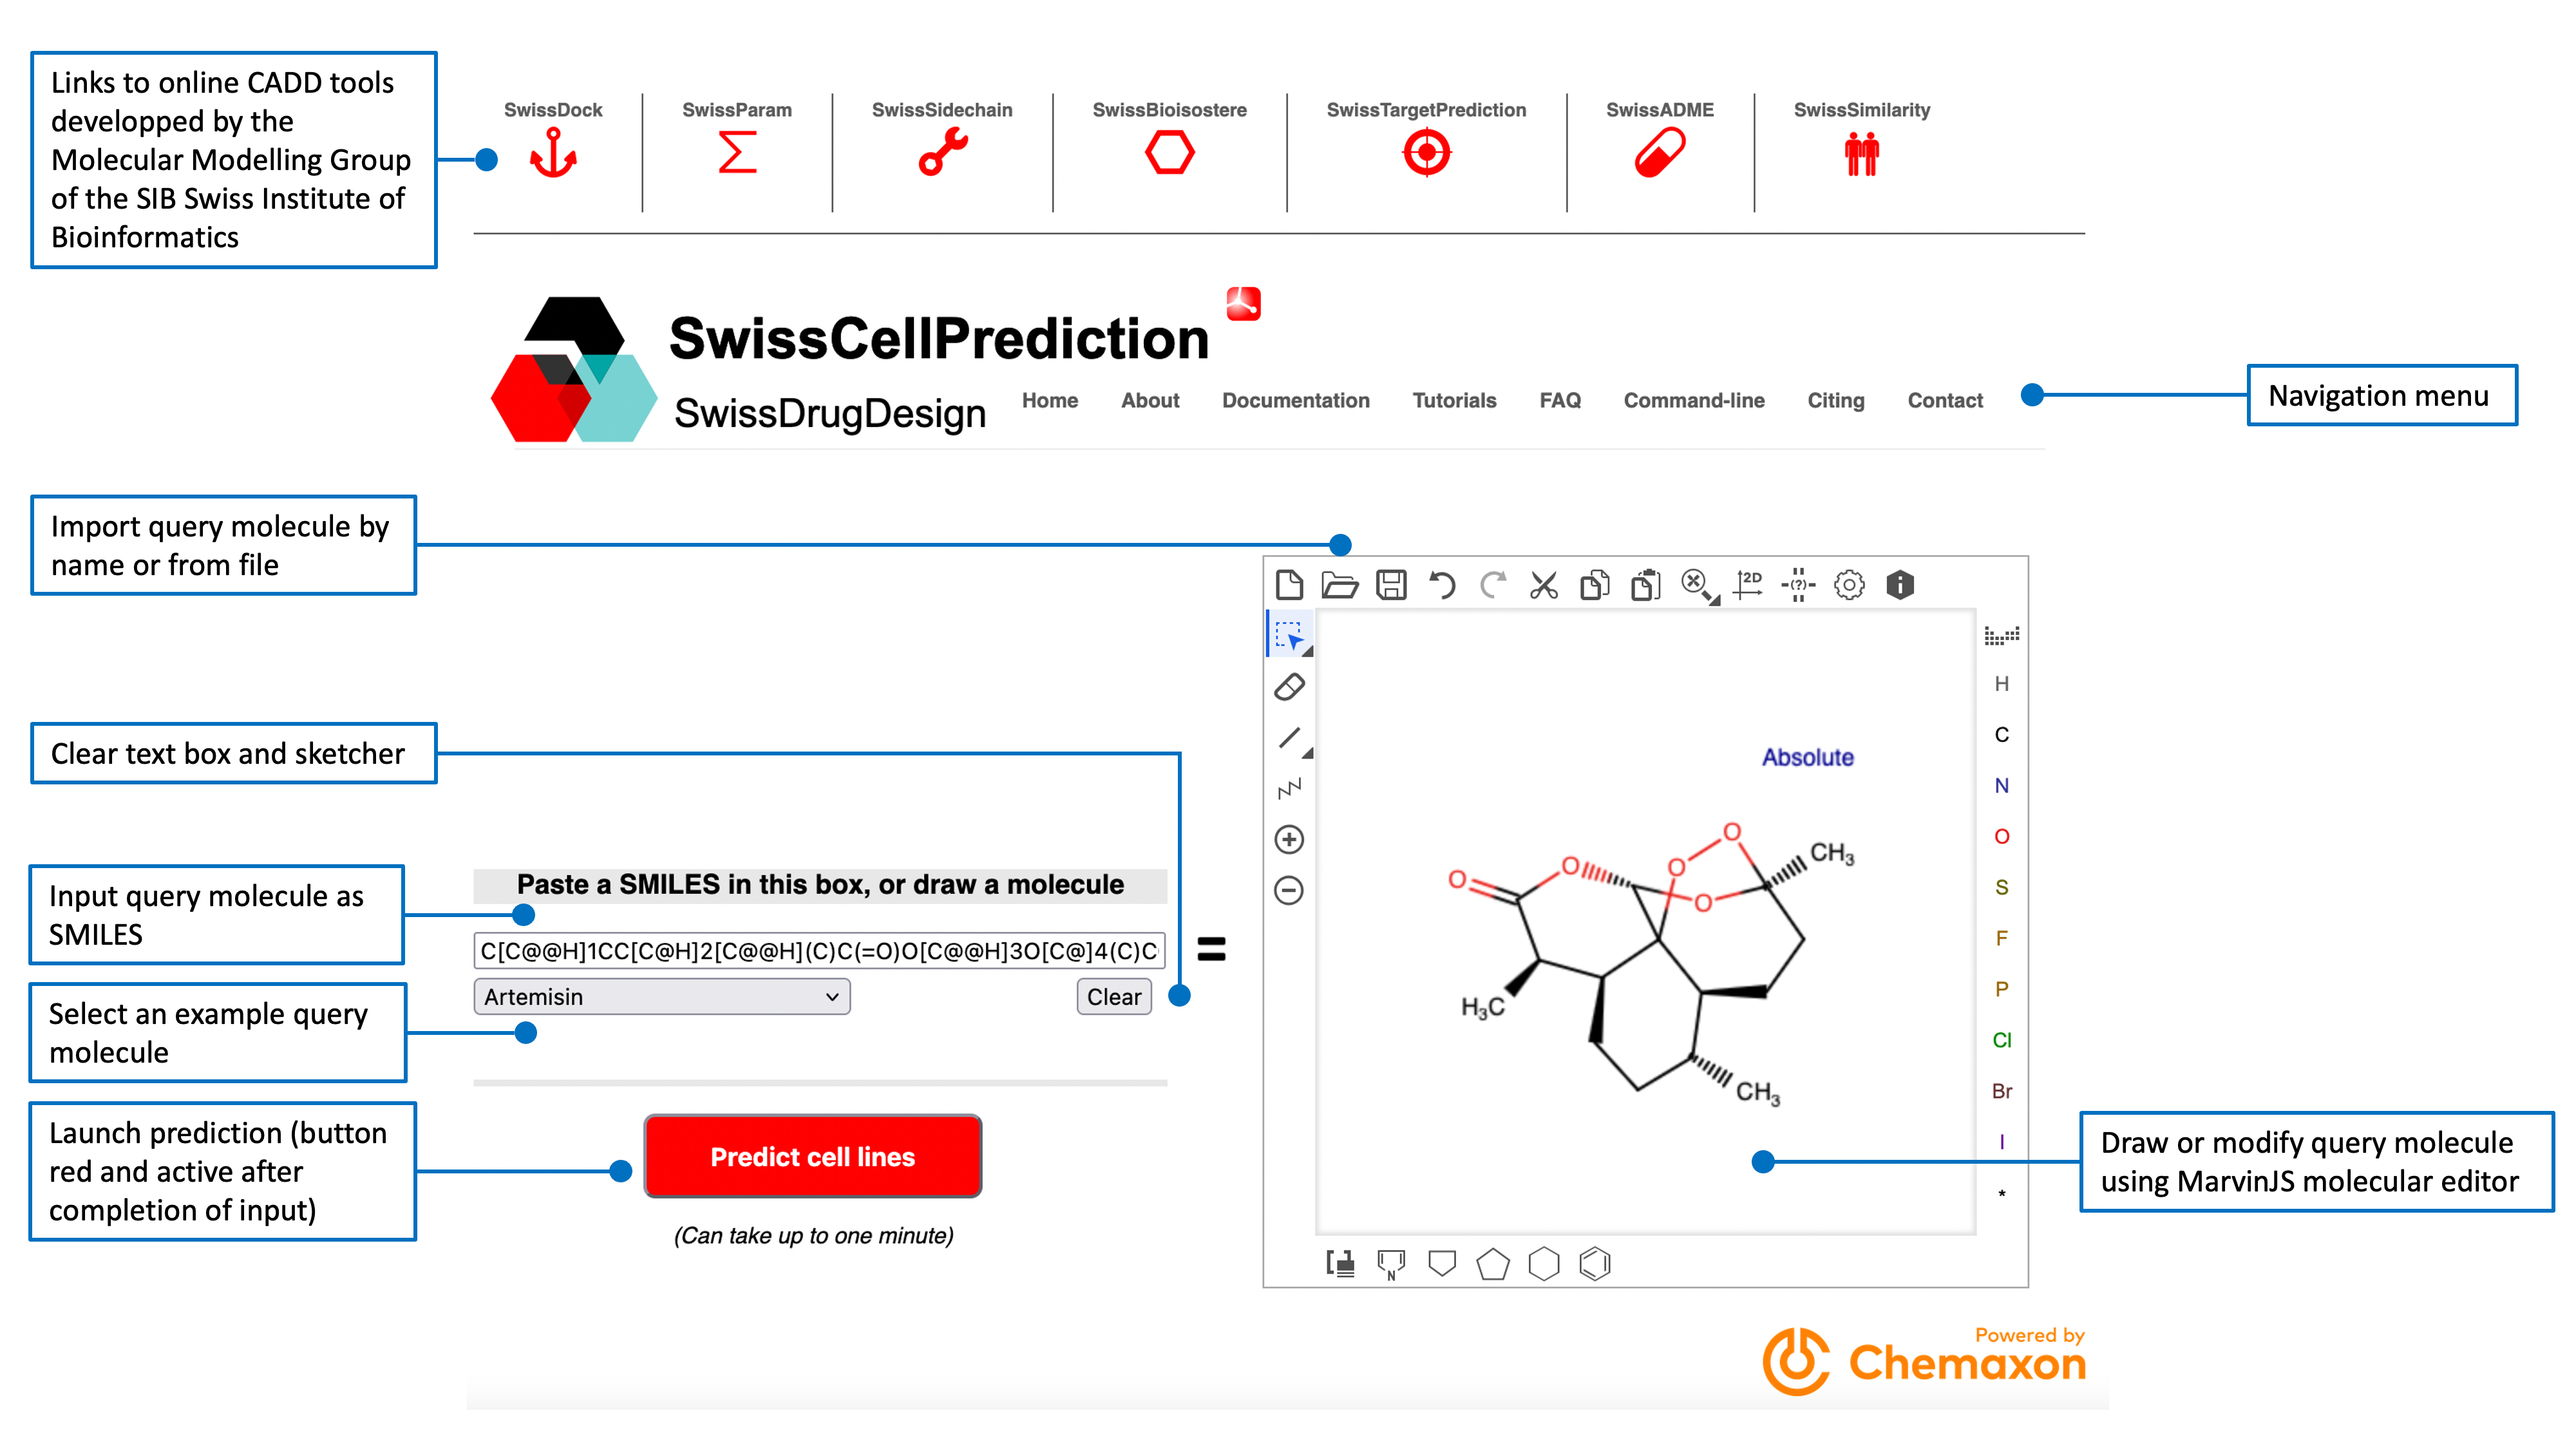
Cell lines are ranked according to their probability of sensitivity (green bars in the main result table) for the query molecule. This probabilitiy value is a logistic regression score from the 2D/3D similarity with all known actives on the cell line. The main table also gives information about the predicted cell lines as species, tissues and associated disease. Links to more detailed descriptions are provided by clicking on the respective ChEMBL and Cellosaurus IDs (directing to the webportal of the database of origin).The last column shows the numbers of known actives that reached a similarity score of at least 0.4 in 2D (Tanimoto coefficient on FP2 fingerprints) and 0.8 in 3D (Manhattan-based similarity on ES5D vectors). The main table can be sorted by clicking on any column header. A text search box allows to filter the results.The pie chart displayed in the top-right box shows the repartition of the primary diseases (Cancer Cell Line Encyclopedia). The top-left box contains the structure of the query molecule and interoperability icons to send it to other SwissDrugDesign webtools developed by the Molecular Modeling Group of the SIB Swiss Institute of Bioinformatics:
- SwissTargetPrediction (target icon
 for prediction of protein targets)
 - SwissSimilarity (twins icon
 for ligand-based virtual screening)
 - SwissADME (pill icon
 for calculation of parameters relevant for physchem, ADME and medicinal chemistry)
 - SwissBioisostere (hexagon icon
 for replacement of molecular fragment)
 - SwissParam (sigma icon
 for parametrizations of molecular docking) are reachable this way
 - SwissCellPrediction (cell icon
 for prediction of cell line targets)
Export options are accessible through dedicated red icons. The user can download the main result table in different formats (PDF, CSV or Excel), copy it to the clipboard or print it directly . The the number of predicted cell lines to display can be adjusted to 15 (default), 25, 50 or all (up to 100).
Numbers in the last column of the main result table are link to other result pages that display the known actives for the corresponding predicted cell line.
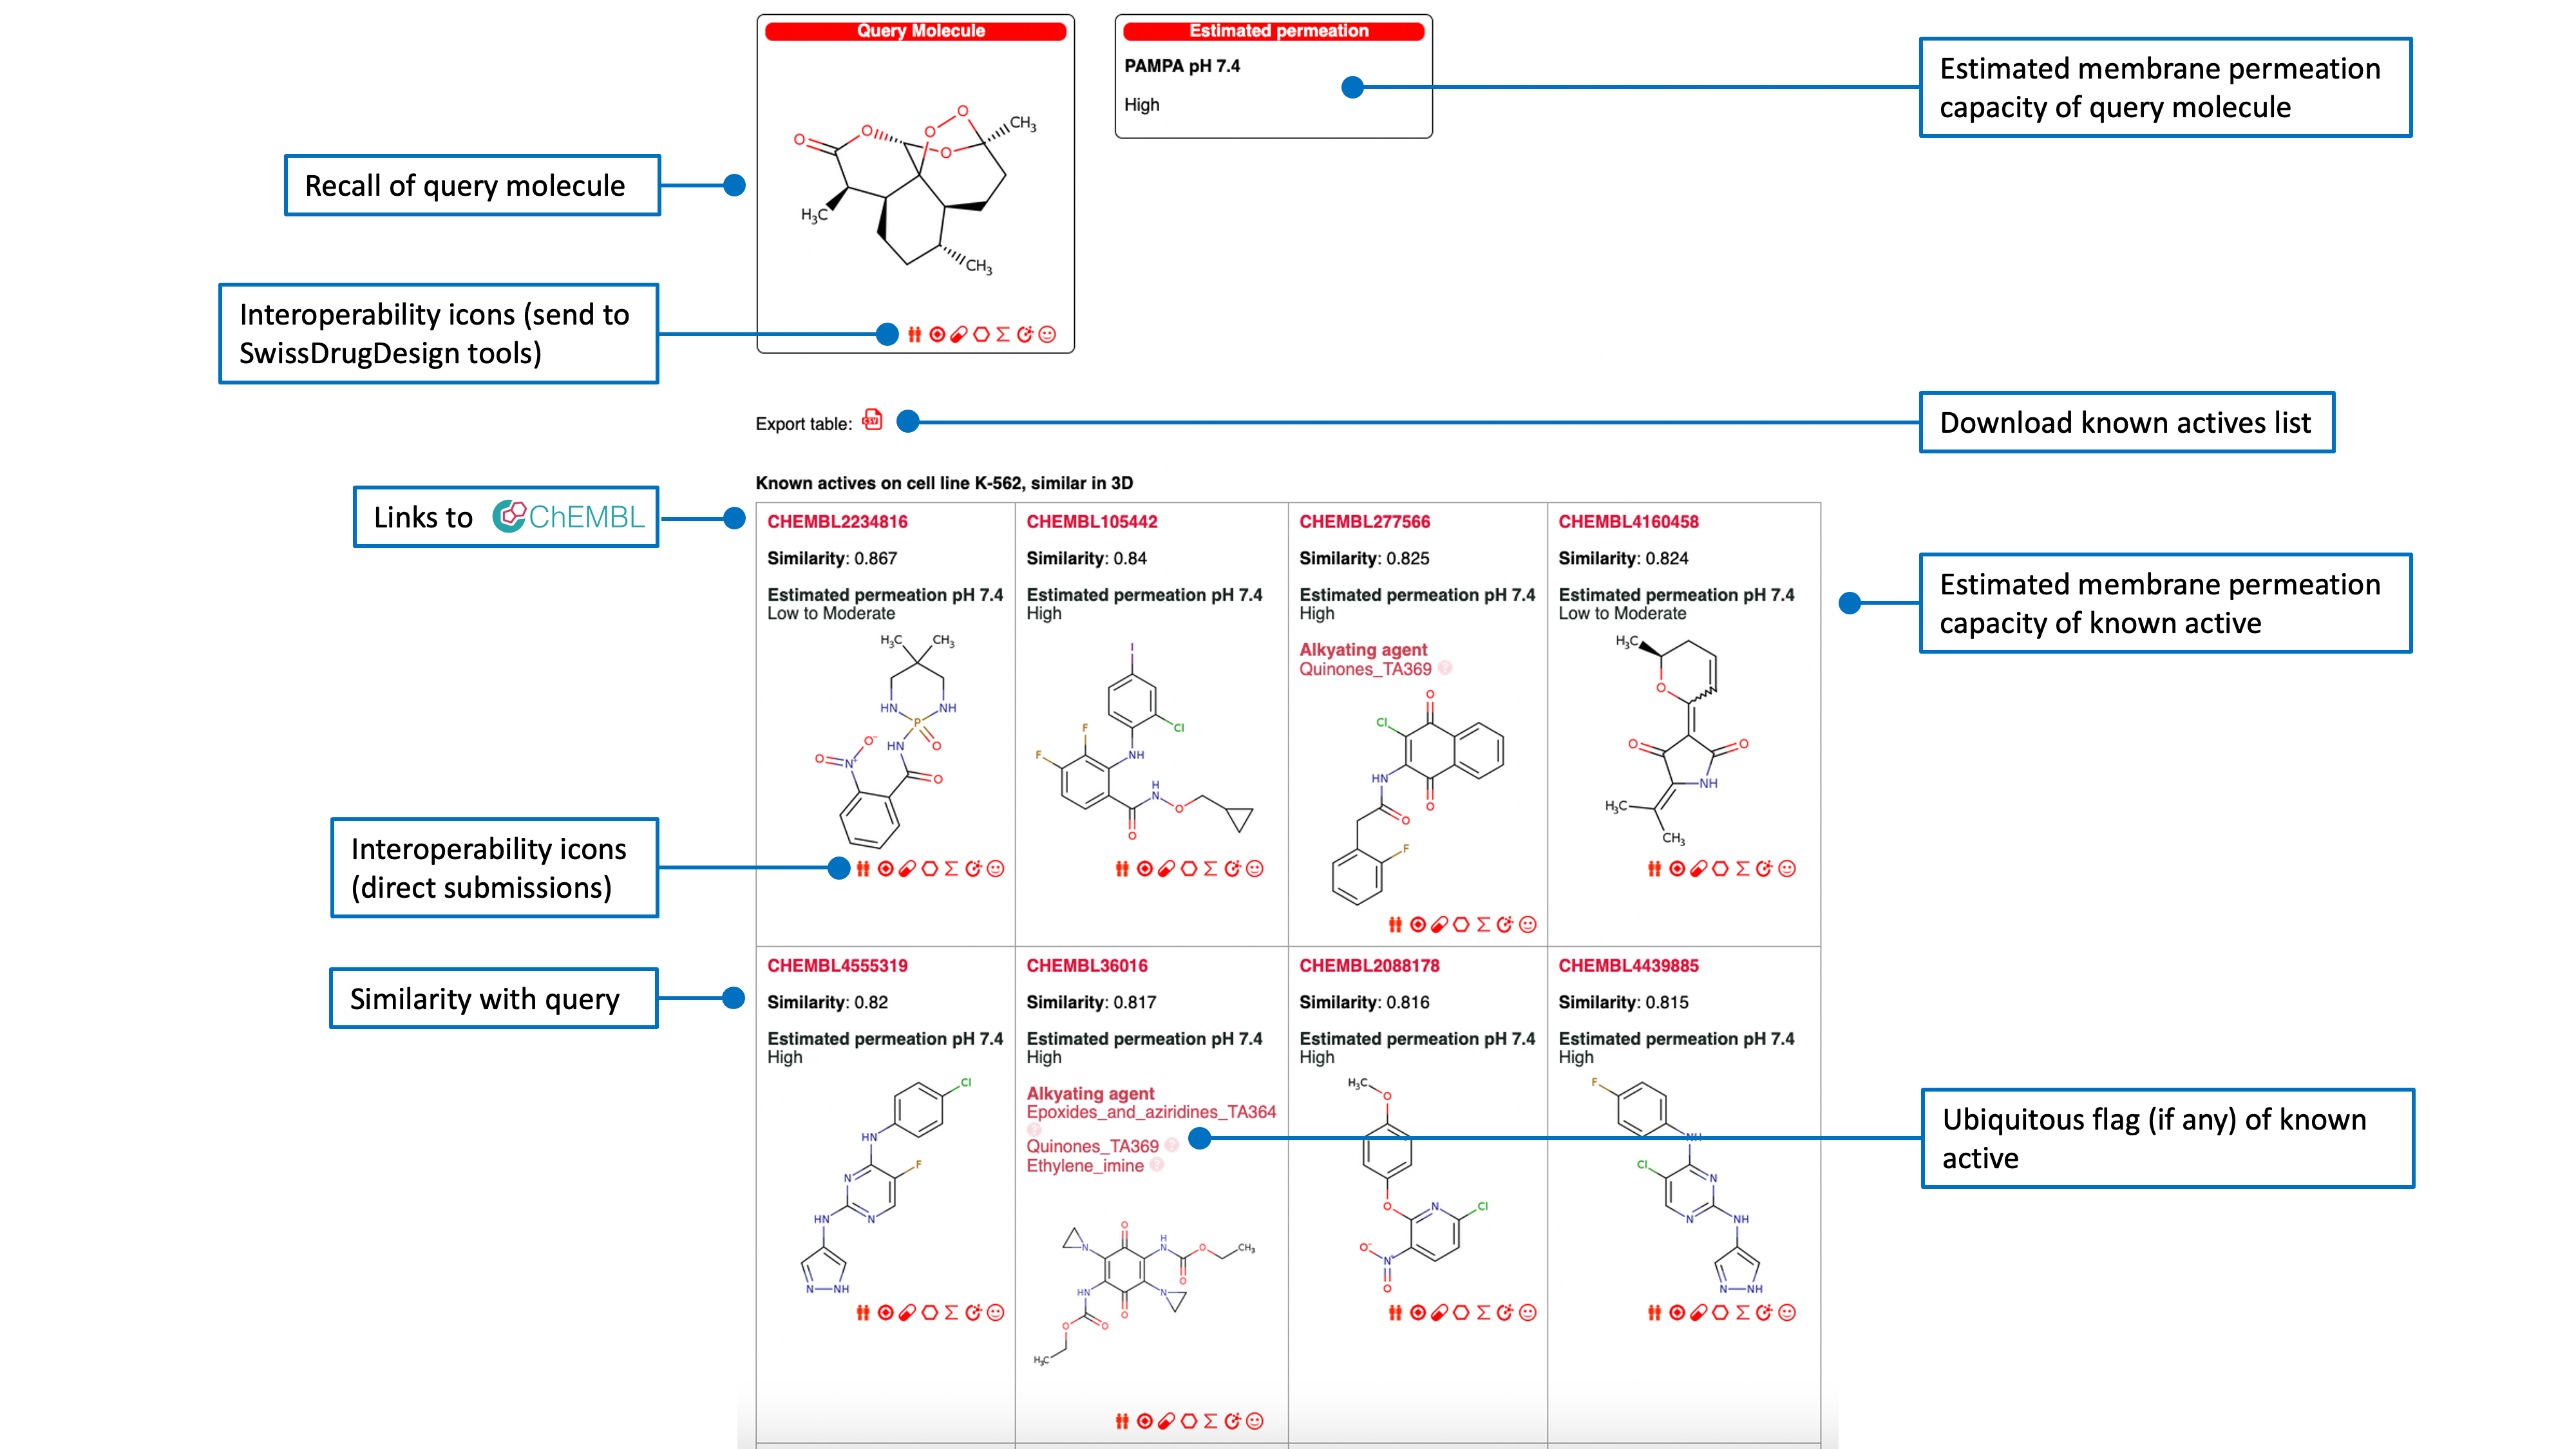
Known actives on a predicted cancer cell line
The list of known actives on the corresponding predicted cell line, is ranked by decreasing (3D or 2D) similarity to the query molecule with access to the ChEMBL Compound Report Card by clicking any ChEMBL ID. An estimation of membrane permeation capacity is indicated. If the active was flagged as ubiquitous the responsible chemical pattern is given.Another red icon just above the table allows the user to export the list of known actives in CSV format.